*

Contact information

* This field is mandatory

*
*
*
*
*
*
*
*
*

By specifying your reason for contact we will be able to provide you with a better service.

We work with partners and distributors who may contact you about this Philips product on our behalf.

*
*

Final CEE consent

Reports guide:


To gain access to the patient survey, revenue summary and branch detail reports, you will need to log into the medSage 2.0 application. Specific users will be given a ‘report only’ role to view your statistics.

The reports that you have access to in the 2.0 application are:


Patient survey report - a summary of aggregate communication attempt outcome

results including patient connections, supplies shipped and notification types.


General Call Metrics

General Call Metrics show statistics on automated communication attempts and their results.  The specific categories displayed are:


  • Unique Patients Called – Reflects the total number of individual patients contacted during the time period displayed.
 
  • Avg Number of Calls Per Patient – Indicates the average number of communication attempts placed in a given period to each unique patient.  Multiplying this number by the “Unique Patients Called” number will yield the total communication attempts for a given period (excluding any failed call attempts.)
 
  • Outgoing Patient Connections – Indicates how many patients have responded to the survey through the system contacting the patient.
 
  • Incoming Patient Connections – Indicates how many patients have responded to the survey by calling in to the toll free number provided on answering machine messages and some patient letters.
 
  • Period Connection Ratio – The ratio compares the outgoing and incoming patient connections with the number of unique patients called.  This displays the percentage of patients called that take the survey.


Supply Order Metrics

Supply Order Metrics display statistics about the supply orders generated by patients tracked in medSage.  The specific categories displayed are:


  • Total Orders Shipped -This number represents the actual count of orders shipped to billable medSage patients for a given period and is obtained directly from billing data provided during periodic updates.  This number will not update until medSage receives new billing data.
 
  • % Patients Connected Who Ordered Supplies – This metric displays the percentage of patients who ordered supplies during the medSage survey.  The ratio is calculated by dividing the “Total Orders Shipped” for a given period by the sum of the “Incoming Patient Connections” and “Outgoing Patient Connections.”
 
  • Total Line Items Requested -This number represents the total number of individual items requested for the month by each patient rather than the number of total orders.  Each order contains one or more line items. (Orders counted include those from both automated and manual communication.)
 
  • Unique Patients Requesting Supplies -This number indicates the count of individual patients who requested supplies.  This number is derived from survey responses where the patient has requested at least one supply. (Patients counted include those from both automated and manual communication.)


Cancelling an open reorder request does not change the number of “Total Line Items Requested” and “Unique Patients Requesting Supplies” as the patient had originally requested supplies on their survey response. Adding a manual order on a given date adds to the count since an additional patient requested supplies on the date that the order is created in medSage.


  • Avg Line Items Per Patient Supply Requested -This metric displays the average of items ordered by each unique patient called.
 
  • Mask, Filter, Tubing, Headgear (Shipped) -This displays confirmed orders shipped and is broken down by individual supply line items, which may differ per application.


Notification Metrics

Notification Metrics display statistics on notifications that have been generated from patient survey responses.  The specific categories displayed are:


  • Unique Patients gen. Notifications -This metric displays how many individual patients generated notifications during the displayed time frame.
 
  • Total Notifications Generated -This metric counts the number of total notifications generated during a reporting period.  Each patient can potentially generate one or more notifications in one survey.
 
  • The listing below “Total Notifications Generated” displays a total count for each individual type of notification generated during a reporting period.
Click here to read moreClick here to read less

Revenue summary report - monthly estimated supply revenue generated based on billing data uploads.


Report Overview


The Revenue Summary Report displays an estimate of total revenue generated on a monthly basis through the automated medSage program. This estimate is the shipped order totals by supply category multiplied by an average reimbursement amount. Return on investment can be tracked by viewing this report; however, it shouldn’t be used for an accurate financial analysis.  The report is provided as a tool to track revenue trends from the automated program.  The accuracy of this report at any point in time is dependent upon each company’s individual order confirmation process and the timeliness of billing data updates sent to medSage.


The first table shows the average reimbursement rates for each line item.  The figures have either been provided to medSage by each company or represent the default Medicare floor amounts.  If the numbers should be changed, contact medSage’s customer service team to discuss adjusting the numbers.


The second table shows average revenue figures.  The report is broken down by line item and by month for the current year.  (Prior years can be viewed by using the drop down menu at the top of the report.)  The report is updated each time billing data is sent to medSage.  The dollar amounts are generated by multiplying the total number of each line item shipped with the average reimbursement rate amount listed in the table above.


Select “Download” to download a spreadsheet, which can be opened in Excel.


This report is affected by data filtering on the application.  If a filter is currently turned on, the filter icon will appear green in the upper right hand corner of the screen.  Clicking on “Advanced Filters” to navigate to the Data Filtering page to change or remove filters.


This report only updates upon the receipt (and processing) of new billing data. Figures on the report may update after the month ends due to the timing of when billing data has been received with confirmed orders for that month.

Click here to read moreClick here to read less

Branch detail report – a summary of patient activity metrics broken down by location.


Report Overview


The “Branch Detail Report” displays patient activity metrics by location (if medSage is configured for multiple branches) against activity for the entire patient population.

Across the top of the application, a a date range filter is present.  The statistics displayed are based on the dates entered.


The Branch Detail Report displays the following information:


  • The reporting period and the current date
 
  • Corporate Totals – This is the first (and sometimes only) row of the report that displays aggregate totals on each metric across all locations.  The individual branch locations (if applicable) will be listed below this total, with a break down of each item
 
  • New Patient Setups – Displays a count of all new patients set up on CPAP therapy for a selected reporting period.
 
  • Training Calls– Displays a count of automated training calls made during the servicing process for a selected reporting period.  When a training call is placed to medSage, the branch number or therapist number should be entered when applicable.  This will register the call for a specific branch if branch IDs are being used.  It is important to utilize the training call with each new patient to help familiarize the patient with the medSage phone call.


A training call can be placed by dialing into the toll free number for the survey. When prompted initially for a phone number, ‘000’ should be entered to indicate that it is a training call. There may then be a prompt for a branch or therapist ID number depending on configuration.

If using therapist ID tracking, the figures do not populate on this report. A monthly spreadsheet is sent to you by medSage’s customer service team with the figures.


  • % Patients Trained – Displays the ratio of training calls to new patient setups in a selected reporting period.
 
  • Unique Patients Called – Displays a count of patients who were called during a selected reporting period.  They may have been called several times, but are only counted once if there was a successful connection.
 
  • Patients Connected – Displays a count of patients called that responded to the automated survey in a selected reporting period.
 
  • Patient Connection Rate – Displays the ratio of Patients Connected to Unique Patients Called.
 
  • Patients Shipped – Displays a count of patients receiving supplies in a selected reporting period.
 
  • % Patients Shipped – Displays the ratio of patients shipped to patients connected (who responded to the survey)
 
  • Active Patients – Automated-Displays a count of patients currently eligible for automated calls for a selected reporting period.
 
  • Active Patients – Manual – Displays a count of all patients currently set to the manual communication mode.
 
  • Unreachable Patients (Current) – Displays a count of patients currently on Unreachable status.
 
  • Inactive Patients – Displays a count of patients currently on Inactive status.
 
  • There are two download options for this report.  Clicking the “Download” button at the top of the report will generate a .csv spreadsheet that can be opened in Excel.  This will display the report that appears on the screen.  Clicking the download links under each heading on the report will display a listing of all patients that fall under that particular reported metric.  For example, the download link under the New Patient Setups will display all newly set up patients reporting to medSage, including the patient’s demographics, medSage status, communication mode, date of setup, integration date, plan call status and automated call history.
Click here to read moreClick here to read less

CBA impact report –  a display of your patient population affected by competitive bidding.


Report Overview

This report is designed to show you how much of your patient population is affected based on areas.


Using the Report

Across the top of the application, a a date range filter is present.  The statistics displayed are based on the dates entered.


To run this report for a specific area:


1.     Select one or more areas in the left hand box


2.     Use the single arrow to move your selection to the right hand box


3.     Click ‘Set Filter’


The report will update to show statistics based on the selected boxes.


Report Display


The table columns provide you the following information:


  • Plan Type:  Differentiates between patients who are set to “Medicare Traditional” plans and those on all other plans.
 
  • Patient Status:  Allows you to see which of your active patients are not going to be contactable due to bidding areas.


  • Age Groups:  Breaks your patients (over 55) into groups based on their birth date allowing you to anticipate when patients (on other plans) will be moving to Medicare plans.


  • # Affected/Total Patients:  A count of patients (over 55) for each category that are affected compared to the number of total patients (over 55) on the plan type.


  • % Affected:  The percentage generated from the # Affected/Total Patients column.  For the patients on the “other” plan type, once the patient turns 65, they will not be eligible for contact if in a lost bidding area.


If your insurance plans are not yet configured to show “Medicare Traditional”, please contact your account consultant.

Click here to read moreClick here to read less

Emailed reports


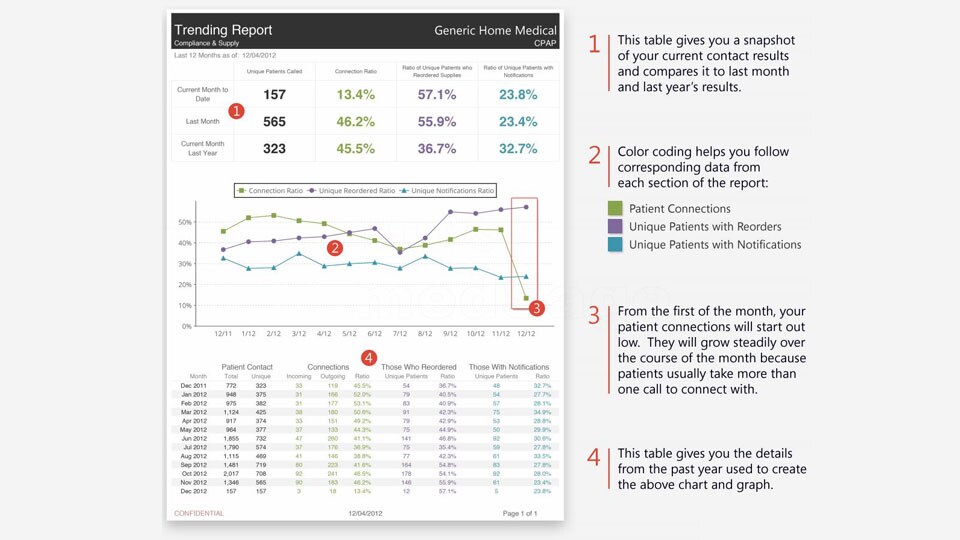
Trending reports - This report can be sent to users of your choice by contacting your medSage account consultant. This report displays call statistics and compares them to results from the same time last year.


Report Overview

This report can be sent to users of your choice by contacting your medSage Account Consultant. This report displays call statistics and compares them to results from the same time last year.

trending report l

You are about to visit a Philips global content page

Continue

You are about to visit a Philips global content page

Continue

Our site can best be viewed with the latest version of Microsoft Edge, Google Chrome or Firefox.