Expert perspective: quantifying liver fat with ultrasound
This research report explores the expert perspective of Richard G. Barr, MD, PhD, FACR, FSRU, FAIUM on the use of ultrasound as a liver fat quantification tool. Dr. Barr is President, Radiology Consultants, Inc. (Youngstown, Ohio); Medical Director, Southwoods Imaging; and Editor In Chief, American Institute of Ultrasound in Medicine (AIUM).

Linked strongly with obesity, non-alcoholic fatty liver disease (NAFLD) is a significant health problem worldwide, affecting as many as one billion people. [1] Current reference standards for diagnosing and measuring NAFLD – liver biopsy and MRI – are impractical for various reasons. The emerging technique of ultrasound attenuation imaging could be helpful in screening for NAFLD. The method is non-invasive and can be done in less than three minutes with good technique. [2]
Continued developments in ultrasound technology are allowing clinicians to detect and stage liver disease earlier in its progression. [3] Ultrasound techniques such as elastography [4] have proven useful in quantifying fibrosis and cirrhosis, and a relatively new ultrasound technique called attenuation imaging has been developed to detect and quantify liver fat in NAFLD.
Who’s affected by NAFLD?
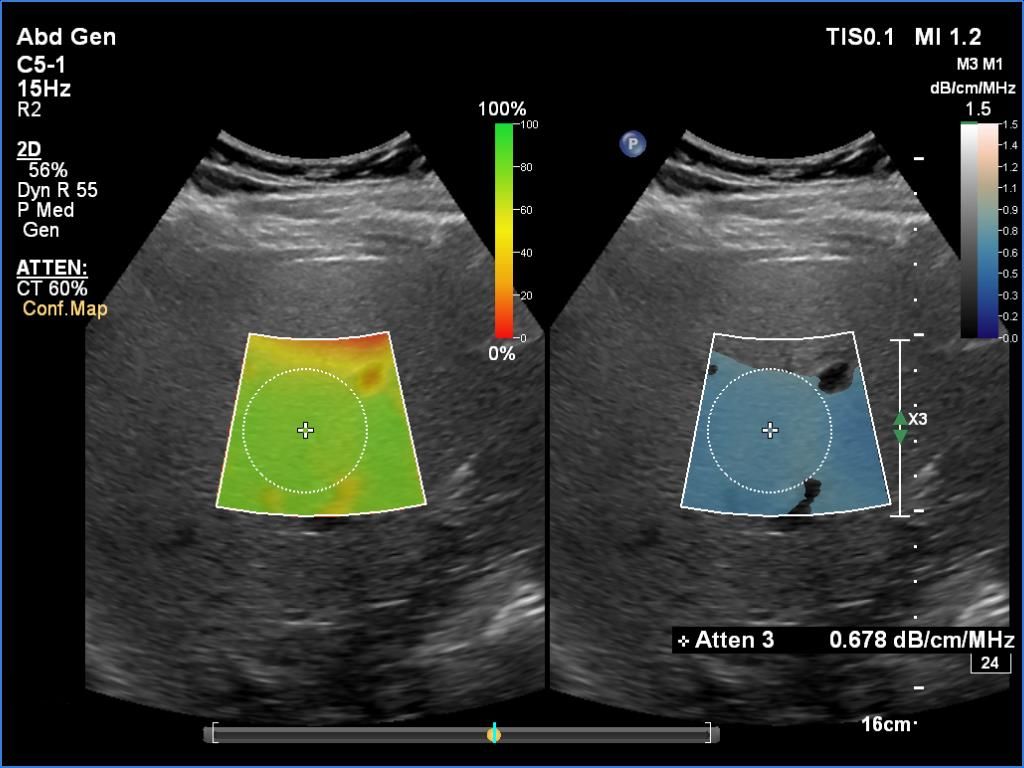
Attenuation imaging is based on the principle of ultrasound attenuation, the measure of how much sound is absorbed as it propagates through the liver parenchyma. It essentially calculates the attenuation coefficient (the rate of amplitude loss) as the pulse travels through tissue. The presence of fat in the hepatic tissue raises the attenuation and reduces the received signal amplitude more than comparable hepatic tissue without fat infiltration.
Dr. Barr has been performing attenuation imaging on patients whose doctors have requested diagnostic liver tests. Patients are typically referred to Southwoods Imaging to determine the cause of right upper quadrant pain and abnormal liver function tests. Dr. Barr says that in the past, he was only able to give a qualitative assessment of liver fat. “Now that there is a quantitative way of measuring liver fat, it will make it a lot easier for us to let the referring physician know where the patient is quantitatively on the NAFLD spectrum,” he says.
For some of these patients, referring physicians also request elastography to obtain a measure of liver stiffness. Both attenuation imaging and elastography can be done during the same ultrasound examination with the patient in the same position and using the same transducer.
“We need to intervene with these individuals before NAFLD turns into NASH [non-alcoholic steatohepatitis], because once that stage is reached, they could develop cirrhosis, hepatocellular carcinoma and/or liver failure,” he says.
With the combination of quantitative fat liver assessment via attenuation imaging and liver stiffness through elastography, the probability of NASH can be better assessed.
Dr. Barr stresses that the goal in attenuation imaging is not necessarily to identify a cut-off value between mild and moderate steatosis, but to observe changes between successive scans.
In all, Dr. Barr’s center has used attenuation imaging on over 200 patients, including more than 100 patients who were part of a retrospective study [8] of chronic liver disease by multiparametric ultrasound, which encompassed attenuation imaging and shear wave imaging. The study concluded that the widespread use of attenuation imaging among the general population could be very useful in screening for advanced chronic liver disease.
“In our practice, almost 50% of the patients for whom we do a liver ultrasound have some degree of fatty infiltration of the liver,” says Dr. Barr. “With the combination of quantitative fat liver assessment via attenuation imaging and liver stiffness through elastography, the probability of NASH can be better assessed.”
